
YouTube Data Scrapping and Dashboard
With the help of YouTube API I scraped details on YouTube channels to be shown in Power BI and Dash dashboards. Here you'll find the technical description on the implementation.

Before the end of the year 2022 I decided to monitor growth on some YouTube channels and try to find anything interesting. Much of it entailed using some data gathering techniques I had never used before, for example, YouTube’s API, set up a local database, and build a nice Dashboard to present insights.
Here’s the technical description on how the scrapping and dashboard were implemented.
While this project was being developed I encountered several roadblocks, many of those I was able to surpass but some others I wasn’t. I’ll describe each step at the best of my abilities for you to know what it entails, what I did, and how.
Setting up a YouTube Developer Account
This is the initial step. Requires you to have a Google account to link your Developer profile and you’ll be able to use several Google APIs, among them, YouTube’s. If you’re not familiar with APIs, this term is an acronym that stands for “application programming interface”, and is a tool that, in this case, will allow you grab data from YouTube using code, for example, you can be interested to know the date of creation of a channel you like or perhaps a list of them.
Your Developer Account provides easy access to all the documentation you need to get started, and more importantly, you can create a project for what you’ll do. Inside a project you’re going to be able to create an API Key, this key will allow YouTube to relate the information that’s being extracted to your project, and it will allow you to access YouTube’s data.
Being an API an application programming interface, the information that you request will return in a JSON formatted file, and these kinds of files are handled better using programming languages, my choice was to use Python.
Preparing a script for scrapping
One function of the API, for YouTube, is to limit the amount of information that can be extracted on a daily basis, Hence, extracting all of YouTube's information is not possible, instead I kept the project’s scope to a set of very few channels, each is uniquely identified on the platform by its Channel ID, which is a combination of letters, numbers, and special characters. The same happens for all videos in the platform, in this case is called Video ID. Both these variables are important, it will indicate YouTube’s what type of information you’re looking for. You can use the channel’s name, but I prefer to avoid ambiguity. You can find this information directly on the page of the Channel of your choice, and inspecting the developer options within your browser.
I decided to focus a list of chosen channels, each with its Channel IDs, and the following metrics:
Number of subscribers.
Number of videos.
Number of views.
Creation Date.
List of uploaded videos (Video IDs).
Using the list of videos from the previous step, I extracted:
Title
Description
Duration
Views
Likes
Number of comments
But this is not even close to all the information available for extraction. If you’re authorized by the channel, you can get even more, to not mention the possibility to manage a channel by automating certain activities, for example, sharing videos, publishing them and/or change their details, check all comments… The possibilities to derive more interesting insights are endless if you’re creative.
Once this data is obtained, we have to keep it stored in a way that facilitate us to handle it. For this, I build a Python script that read my list of channels, perform all the actions to search the beforementioned information for the channel and its videos, and saved it locally. This allowed me to use an old computer for this task. My idea was that I could turn it on everyday, extract, and save a file for me to later take a look at.
Building this took me some time, I have a full time job and I didn’t want to spend too much time taking a look for errors or bugs if something failed when I ran the script. It is also the case that for each API you use, you’ll have to get some time to be familiar with the documentation. Fortunately, Chat GPT helped a lot when I got stuck, I can’t deny that asking practical questions mixed with a tone of underlaying frustration are some of the best practices to get useful responses from it.
Preparing Data for Dashboard ingestion
At this stage is important to reflect on the data you have, what do you want to do with it, and how do you envision sharing it. For the purposes of this project I set up a local MySQL database that follows the Logical Relationship Diagram shown below:
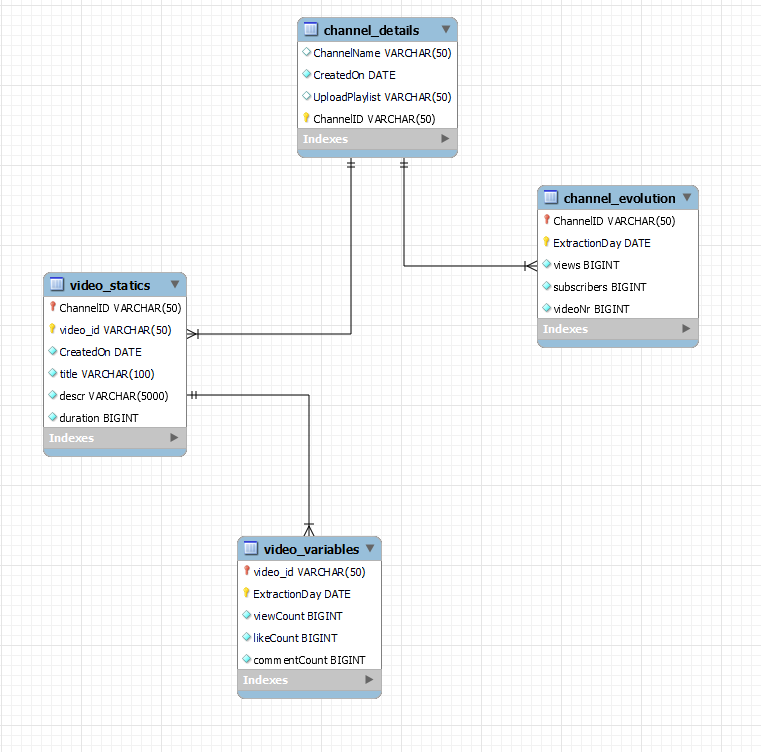
Since some channel and video level variables are kept usually unchanged, the table channel_details and video_statics store that respectively. The tables channel_evolution and video_variables store the information on other variables on a period of time, but notice that fore these last two, the column “ExtractionDay” is a primary key to prevent information duplication on a video or channel at the day level, giving us a time dimension for analysis. In this GitHub repository you’ll be able to find the script to create this database yourself.
At this stage, a second script is set in place to upload several daily extractions on bulk. I usually left them accumulate, and upload them to the database.
Preparing the data for the Dashboard
I wanted to be able to not only pull out data from the MySQL database but I also wanted to do it in such a way that allowed me for easy modeling in Power BI (Dash comes later down the road).
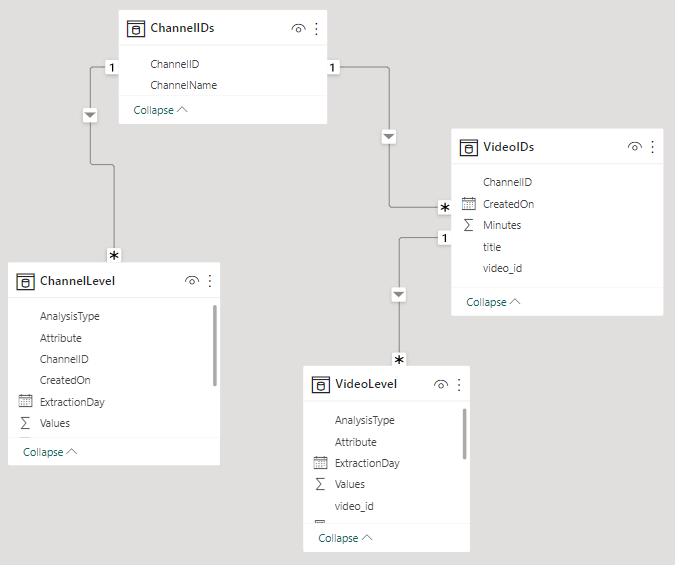
I built another Python script (available in repo) that handled all the data preparation in such a way that allowed the user to check any channel and video not only for Actual values but also Evolution, for example, actual views and difference of views from one day to another. An extra important requirement, to comply with the YouTube’s API terms of service is to not expose any creator, therefore the information is anonymized.
This final script, results in 4 csv files, each one as source of the following tables, best represented in our Power BI model:
After some personalization’s, color coding, layout management, and perhaps some DAX you should be able to have a Power BI report worth sharing. Sadly, although that I delved into the Microsoft documentation, some Reddit forums, and Google, I was unable to share the report in a way that users without any Power BI licencing were allowed for view, and that didn’t entailed a long list of expenses. Here’s a peek on its appearance:


Having this roadblock, I had to find another way of sharing these insights, therefore I dusted off my Dash and started building a new dashboard. Although is no my most usual go-to dashboarding solution, I thought it would be convenient for this project to be able to share insights through services such as Heroku, but a lot has changed since the last time I’ve used it. It would’ve entailed migrating the Database as well as preparing another dashboard pipeline for web, at least in terms of technical requirements, I rather kept things simple for now and here’s a peak into the app’s looks:


In the following days, I’ll be sharing more details on how, with the help of the visualizations on these dashboards, that combine views, videos, likes, and comments you’re in a better position to assess a channel’s growth, and innovation trend. Subscribe for free to this blog if you want to get notified for that.
Here you can find all the code if you’ll like to use any of these components. Thank you for reading.